Create and run an A/B test
You can create new tests on the dashboard. Here’s what the process looks like:
Set up the test
Some of the instructions below only apply to A/B testing with two different indices. You can ignore those parts if you are doing A/B testing on a single index.
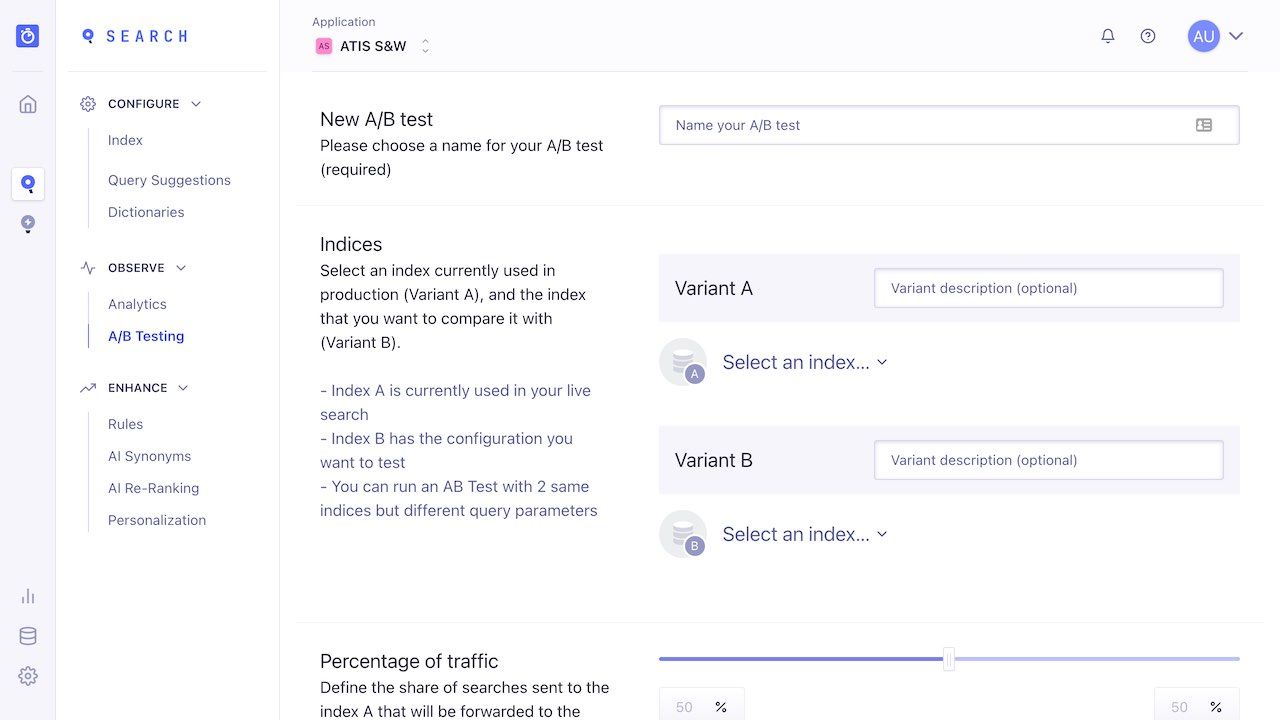
You need to provide four pieces of information to get a test up and running:
-
The test name: when creating your test, always use descriptive names so you can easily understand the purpose of the test. For example, if you are comparing the “most-viewed” and “most-sold” sort orders, a good name would be “Which is better - most-viewed or most-sold?”.
-
Your A and B indices: A is the control index, your main index. B is your comparison index. The A and B indices are referred to as scenarios. Each index should return different results. You can set a description for each index: make it readable so that you can understand, at a glance, the nature of the scenario.
-
The percentage of traffic for A and B: you might want 50% of your searches to use index A and the other half to use index B. Or you might want your test to use B less often, especially if you are unsure about the change. If this is the case, you can allocate a lower usage to index B; 30% for example, making the split 70/30.
-
Test duration: To ensure reliable results, your test must collect a certain amount of data over an appropriate time period. You can choose to run your test for between 1 and 90 days. Generally, set a duration that allows enough time to reach statistical confidence. Low-usage sites need longer test durations than high-usage websites.
Estimate sample size and test duration
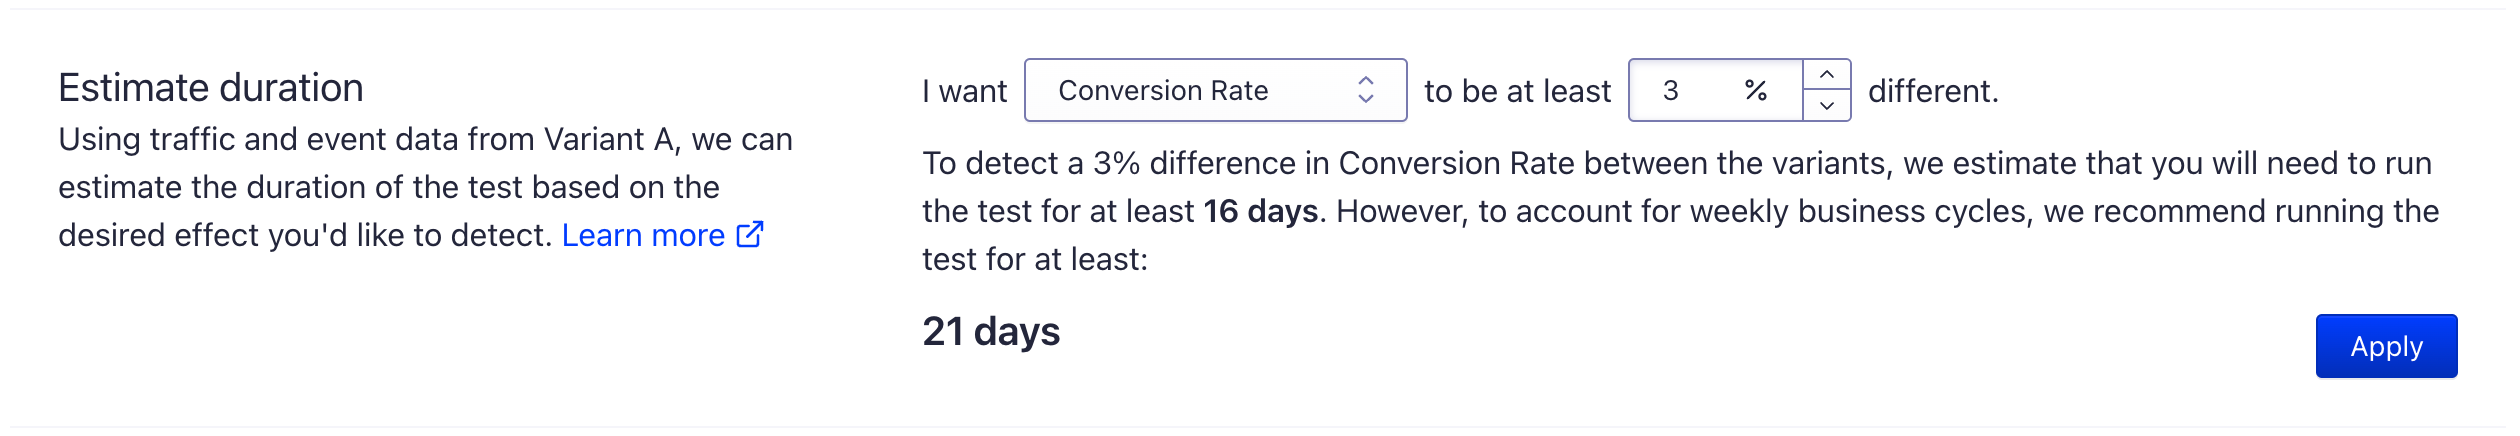
Accurately determining the sample size is essential for effective A/B testing and ensuring reliable results. The sample size estimation tool simplifies this process by estimating the number of searches needed to confidently detect meaningful differences between experiment variations.
Sample size estimator
The sample size estimator uses your historical data to establish a baseline for performance metrics, such as conversion rates or click-through rates. Based on these metrics, it calculates the optimal sample size needed to detect any significant changes. With fixed statistical parameters—80% power and a 5% significance level—the tool ensures robust and reliable results.
Key features:
- Historical baseline rate. The tool uses your existing data to determine the current performance metric, such as conversion rate or click-through rate, against the measured changes.
- Fixed statistical parameters. A statistical power of 80% and a significance level of 5% provide a balance between detecting true effects and minimizing false positives.
- Customizable metrics and effect size. Select the specific metric you want to measure, such as conversions or clicks, and define the minimum detectable effect size that aligns with your business objectives.
Choose an appropriate effect size
The effect size is the smallest relative change in a metric that you consider significant enough to act on. Choosing an appropriate effect size is essential for accurate and efficient A/B tests.
For example, if you would adopt a new feature only if it increases your conversion rate by 5%, set your effect size to 5%. With a baseline conversion rate of 10% for your main index (A), the new feature would need to raise the rate to 10.5% (a 5% relative increase) for the test to be successful. The sample size estimation tool will then calculate the searches needed to detect this change with 80% power and a 5% significance level.
When choosing an effect size, consider these guidelines:
- Business impact. Consider the smallest change that would have a meaningful impact on your business goals. For example, a 2% relative increase in conversion rate might be significant for one business, while another might aim for a 5% relative change.
- Historical data. Review past experiments to understand typical variations and set an effect size that is realistic and achievable based on historical performance. For example, if other changes you have tested typically result in a 3% relative increase in conversion rate, you might set your effect size to 3%.
- Balance between sensitivity and practicality: Smaller effect sizes, such as 1% to 2% require larger sample sizes but let you detect subtle changes. Larger effect sizes (for example 5% to 10%) require smaller samples and are easier to detect but may overlook smaller yet important changes.
Starting your A/B test
Pressing “Create” starts your A/B test. Once a test is created, it starts running immediately. At this point, you can either stop the test before its planned duration (but be careful, you cannot restart it!), or wait until it is completed.
You cannot pause a test because doing so would undermine the accuracy of the data: full, continuous testing, without outside interference, is a necessary part of A/B testing.
View the results
You can view running or completed tests. The results table shows the scores for each variant, how many users and searches are involved in the test, and how statistically significant the observed results are (confidence). For example:
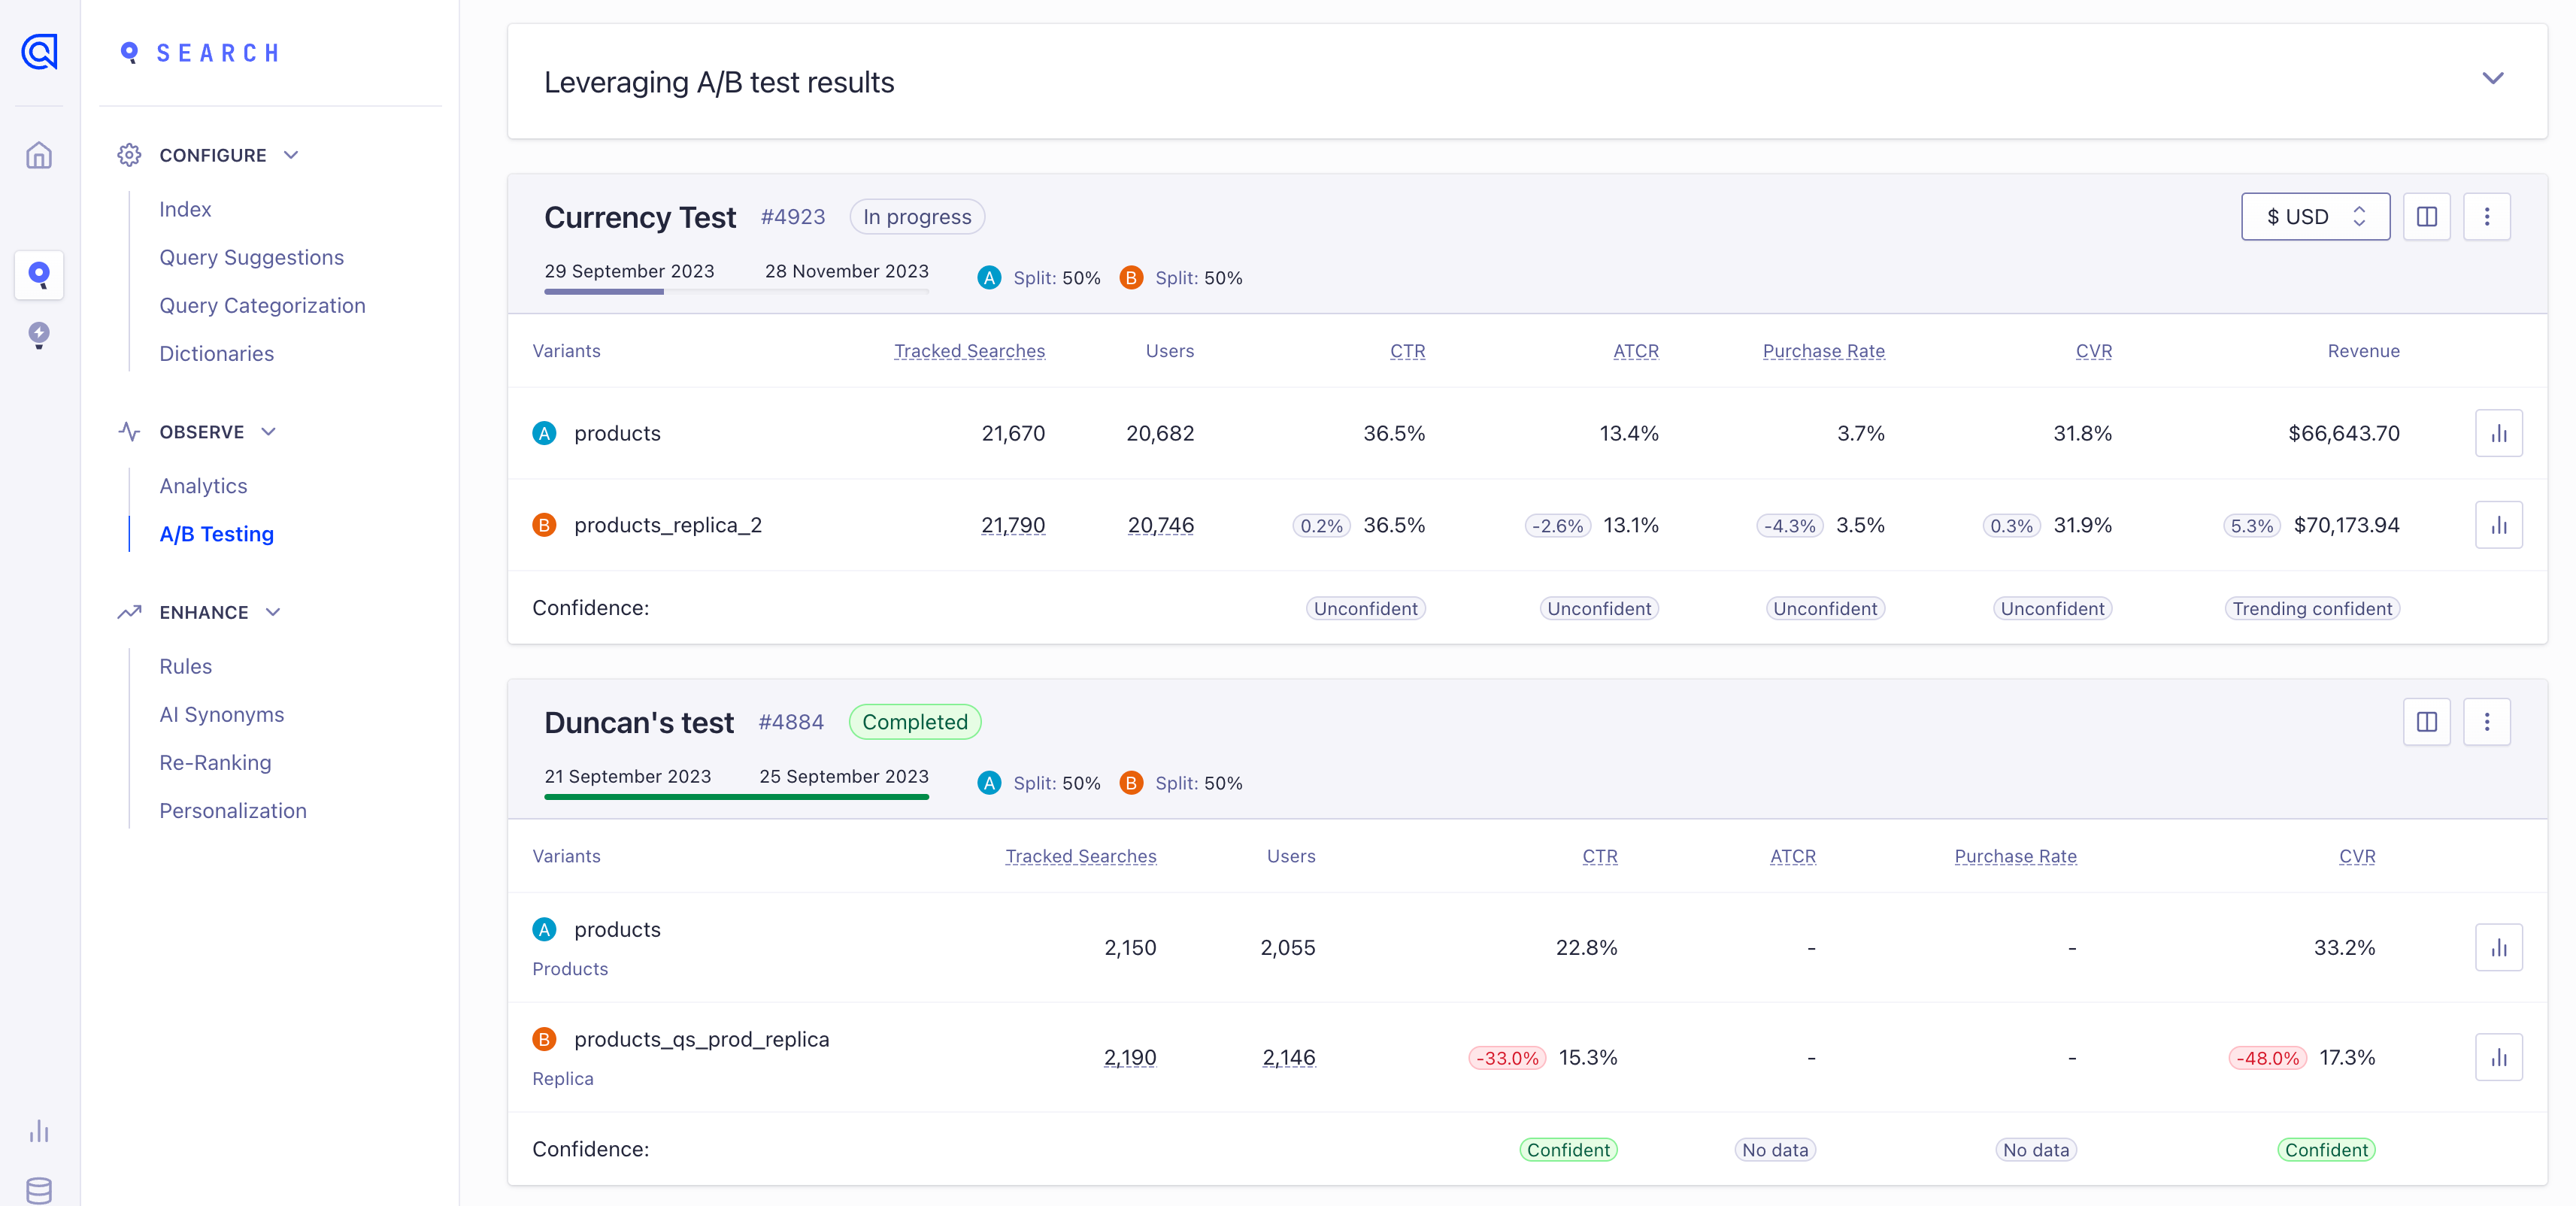
Each test has 2 rows and 5 columns. Each row represents one variant of the A/B test. This could be a different index, or a different set of query parameters on the same index (A/A test) depending on how the test was set up.
Descriptive elements: you see the titles and descriptions of your scenarios, as well as the allocation and duration choices you made in creating the test.
- The Menu: on the first row, top right, you can stop a test. You can also delete the results.
- Status: to the right of the title and test ID, you can find the status of the test. Possible statuses are:
In progress - Earlyfor a recently created test,Stopped,Completed,Failed, orIn progress(along with how many days are left).
Data Columns/Rows:
- Searches and users: these figures indicate the sufficiency of the data and the fairness of the allocation.
- Click-through, Conversion, Purchase, and Add-to-cart Rates: these figures create the performance comparisons, showing whether index A or B is providing better results. Purchase and add-to-cart rates are calculated globally for the variant, rather than per-currency, and only display if you track the relevant revenue events.
- Revenue: this column shows the revenue generated by each variant for the selected currency. This column is only shown if you track the relevant revenue events.
- Confidence: the final row contains the confidence, which tells you whether a test is statistically significant. If possible, you should wait until the A/B test has completed before interpreting the results. Hovering over a column’s confidence shows the p-value for the test, as well as an interpretation of the result.
For more information, see:
A/B tests show results in the dashboard within the first hour after you created them, but metric comparisons won’t show until at least 1 week or 20% of the test duration has elapsed. This prevents drawing conclusions before enough data is collected. Test results are updated daily.
Test Statuses
The different test states are:
- In progress - Early: the test has started, and there is insufficient data to draw reliable conclusions. Wait for at least one week, or 20% of the test duration, before metrics begin to show. Hover over the badges to see data, but avoid drawing conclusions during this stage.
- In progress: the test has been running for a while, and metrics are being collected and compared.
- Failed: the test couldn’t be created. This is usually due to an issue with your index, or provisioning the test to the Search API. Try to create the test again, or contact Algolia Support.
- Stopped: the test was stopped manually and can’t be restarted. Your application is back to normal: index A performs as usual, receiving 100% of search requests. When you stop a test, all associated metadata and metrics are stored, and the test remains visible in the Algolia dashboard. When a test is stopped early, the results may be inconclusive.
- Completed: the test has finished. Your application is back to normal: index A performs as usual, receiving 100% of search requests. Results can be interpreted based on the confidence level.
If you delete a test, all associated metadata and metrics are deleted, and the test is removed from the Algolia dashboard.
Interpreting results
See also math and statistics methodology.
What you consider good or bad is entirely dependent on your website and business. You need to compare the cost of an improvement with its benefits. A 4% improvement of CTR might not be convincing or profitable enough to warrant a change to the structure of your records.
It’s the same with conversion rates: we can’t tell you what a good conversion rate improvement is for your application. That said, because changing settings or pushing different data is usually a low-cost option, you should almost always implement any possible improvement.
Confidence
The confidence for a test is based on the test status, and the measured p-value. The lower the p-value, the higher the likelihood that the observed difference between the variants is not due to chance.
The different confidence levels are:
- Too early to interpret: the test has started, and there is insufficient data to draw reliable conclusions on the performance of the variants. Wait for at least a week, or 20% of the test duration, before metrics begin to show. Hover over the badges to see data, but avoid drawing conclusions during this stage.
- No data: the test has been running for a while, but there is no data to compare. This is usually due to no events being tracked.
- Unconfident: the test has been running for a while, but it’s impossible to tell whether the observed change is representative of the true impact. This could change as more data is collected. You should be careful when interpreting these results.
- Trending confident: the test has been running for a while, and it currently looks like the observed change reflects the true impact. This could change as more data is collected. Be careful when you interpret these results.
- Inconclusive: the test has finished, but the confidence is too low to determine whether the observed change is due to chance. This could be due to insufficient data, or because the variants are too similar.
- Confident: the test has finished, and it’s very likely that the observed change reflects the true impact.
Confidence, or trending confidence, does not mean that the change is good. It just means that the observed change is not due to chance. Examples:
- A Confident result, with a large decrease in observed conversion rate difference means that the change will likely lower your conversion rate. If your goal was to increase conversion rates, you should not implement the change.
- A Confident result, with a large increase in observed conversion rate difference means that the change will likely increase your conversion rate. If your goal was to increase conversion rates, you could implement the change.
- A Trending confident result, with a large increase in observed conversion rate difference means that currently the change looks to increase your conversion rate. You could implement the change based on your business needs, but the confidence might change later.
- Any Inconclusive test means that the impact can’t be determined accurately. You should ignore the results or interpret them with discretion. Try re-launching the test for a longer duration to collect more data. This increases the likelihood (but does not guarantee it) that the results will reach a confident state.
Minimum number of searches
You can stop your tests at any time and analyze the test results with as little or as much data as you want. Drawing conclusions based on insufficient data and low confidence test results might lower your overall search performance and lead to unexpected results.
The confidence indicator is calculated to ensure confidence and reliability of the test results. Using the confidence indicator as a guideline protects you from jumping to conclusions too early based on skewed or insufficient data.
Best Practices
-
Test before going live: Be wary of breaking anything. For example, make sure that both your test indices work smoothly with your UI. Small changes can break your interface or strongly impact user experience. For example, making a change that affects facets can fail the UI facet logic. Or changing a simple ranking on index B can make the search results so bad that users of this index will have terrible results. This is not the purpose of A/B Testing. Index B should theoretically be better, and if not, at least as good as index A.
-
Don’t change your A or B indices during a test: do not adjust settings during testing. This pollutes your test results, making them unreliable. If you must update your data, do so synchronously for both indices, and, preferably, restart your test. Changing data or settings during a test can break your search experience, and undermine the conclusions of your test.
-
Don’t use the same index for multiple A/B Tests. You cannot use the same index in more than one test at the same time. You will get an error.
-
Make only small changes: The more features you test simultaneously, the harder it is to determine causality.
The API
While you can run and leverage A/B tests directly from the Dashboard, some situations can benefit from testing directly with our API clients:
-
You want to run the same test across many indices, for example, if you have many websites using the same kind of indices but with different data. With the API you can create multiple tests more easily.
-
You want your backend to trigger tests based on data changes, or create feedback loops based on your analytics, as used in machine-learning. This is an advanced method of managing product-line changes or industry trends and should be done carefully.
These are unique use cases. We expect the majority of our clients to use the Dashboard to manage A/B tests.
Note, to use the API, your API key ACL must include:
- A/B Test creation/deletion - setSettings on all indices
- A/B Test analytics - analytics on all indices
